Roughly two out of three American workers now hold some kind of retirement account, and the average 401(k) balance sits between $125,000 and $135,000 as of 2025-2026. Here’s the part almost nobody clocks: most of that money wasn’t earned by clever stock-picking. It was built by compound interest—quiet, relentless, mathematical—doing the heavy lifting while savers went about their lives. That mechanism has a much longer backstory than you’d guess.
Key milestones: (Related: this analysis of How to Negotiate a Lower Interest Rate (Avoid These Costly M.)
- c. 2000 BCE — Babylonian clay tablets record loans where interest itself earns interest
- 1494 — Luca Pacioli publishes the earliest known reference to the Rule of 72
- 1790 — Benjamin Franklin’s will leaves £2,000 to Boston and Philadelphia to compound for 200 years
- 1978 — Section 401(k) is added to the US tax code, enabling tax-deferred compounding for the masses
- 2025-2026 — Retirement balances hit record highs, driven largely by decades of compounding
So why dust off ancient math instead of just opening a brokerage app? Because the mechanics haven’t changed in four millennia—only the packaging has. Understanding where compounding came from explains why time, not timing, is the single biggest lever you actually control. It also reveals why the people who grasped this early—Franklin, the Babylonian scribes, the index-fund pioneers—kept pulling ahead while everyone chasing the next hot tip fell behind.
The lesson repeats in every era: small, consistent contributions plus patience beat sporadic bursts of brilliance. That’s not motivational fluff—it’s arithmetic. You can watch it happen yourself in about 30 seconds using the SEC’s free compound interest calculator. The timeline above shows how humans slowly learned to trust that math; the sections ahead show how to put it to work.
The Ancient Roots of Compounding (2000 BCE–1494 CE)
Long before spreadsheets, Babylonian scribes were already wrestling with interest on interest. Clay tablets dating to roughly 2000 BCE—still studied by mathematicians and historians today—record loans that accrued at rates near 20% annually, with the interest itself earning interest over time. The Sumerians even used a single word, máš, for both “interest” and “calf,” tying the abstract idea of growth to something tangible: livestock that multiplies on its own.
One famous tablet poses a problem any modern investor would recognize: how long does it take a sum of money to double at 20% interest? The scribe’s answer lands just under four years—a hand-calculated cousin of the shortcut we’d later call the Rule of 72.
But ancient compounding cut both ways. Rates that steep meant debts ballooned fast, so Mesopotamian rulers periodically declared debt cancellations—”clean slate” decrees—to keep borrowers from being crushed by exponential math. It’s the earliest recorded proof that compound interest is a force multiplier in both directions: a wealth engine for lenders and savers, a trap for the overextended.
That duality still defines personal finance in 2026. The same mechanism that grows a $500 monthly retirement contribution into seven figures over 40 years is the one that turns credit-card balances at 22-27% APR into a spiral. According to the Federal Reserve’s consumer credit data, US household debt keeps setting records—proof that most people feel compounding as a headwind long before they ever harness it as a tailwind.
Fast-forward roughly 3,500 years, and the idea finally got its first great simplification. In 1494, the Italian friar and mathematician Luca Pacioli—often called the father of modern accounting—published Summa de arithmetica, containing the earliest known reference to the Rule of 72: divide 72 by your annual return to estimate how many years it takes your money to double. At 8%, that’s about nine years. It isn’t perfectly precise, but as Investopedia notes, it’s close enough to run compound-interest math in your head—no clay tablet required. Pacioli turned a scribe’s laborious calculation into a mental shortcut anyone could carry.
The Babylonians had to grind out every doubling by hand on clay; you can automate all of it and let the math run in the background. To see what that looks like across a full working life, follow a single saver through four decades of steady contributions.
Years 1–10: The frustrating flat stretch
Picture a 25-year-old who commits $500 a month to a low-cost index fund earning roughly 7% a year — a figure loosely anchored to the S&P 500’s long-run, inflation-adjusted average. Over the first decade she puts in $60,000 of her own money. By the end of year 10, her balance sits near $86,500. The growth — about $26,500 — feels almost invisible against the discipline of setting aside $6,000 every single year.
Why it matters: This is the stretch where most people quit, because the returns look thin. The account is still dominated by contributions rather than compounding, so progress tracks closely with sheer effort. Yet the habit formed here is the whole ballgame. Every dollar invested at 25 gets roughly four decades to multiply; the identical dollar invested at 45 gets half the runway and a small fraction of the eventual payoff. Time, not timing, does the heavy lifting.
Years 10–20: Momentum quietly gathers
By year 20, the same investor has contributed $120,000 — double her earlier total — but her balance has climbed to roughly $260,000. Notice the asymmetry: contributions merely doubled, while the account nearly tripled. Growth now accounts for about $140,000, meaning the money the portfolio earned has, for the first time, overtaken the money she personally deposited. We covered our guide on Understanding Your Credit Report: The Complete 2026 Guide in detail elsewhere.
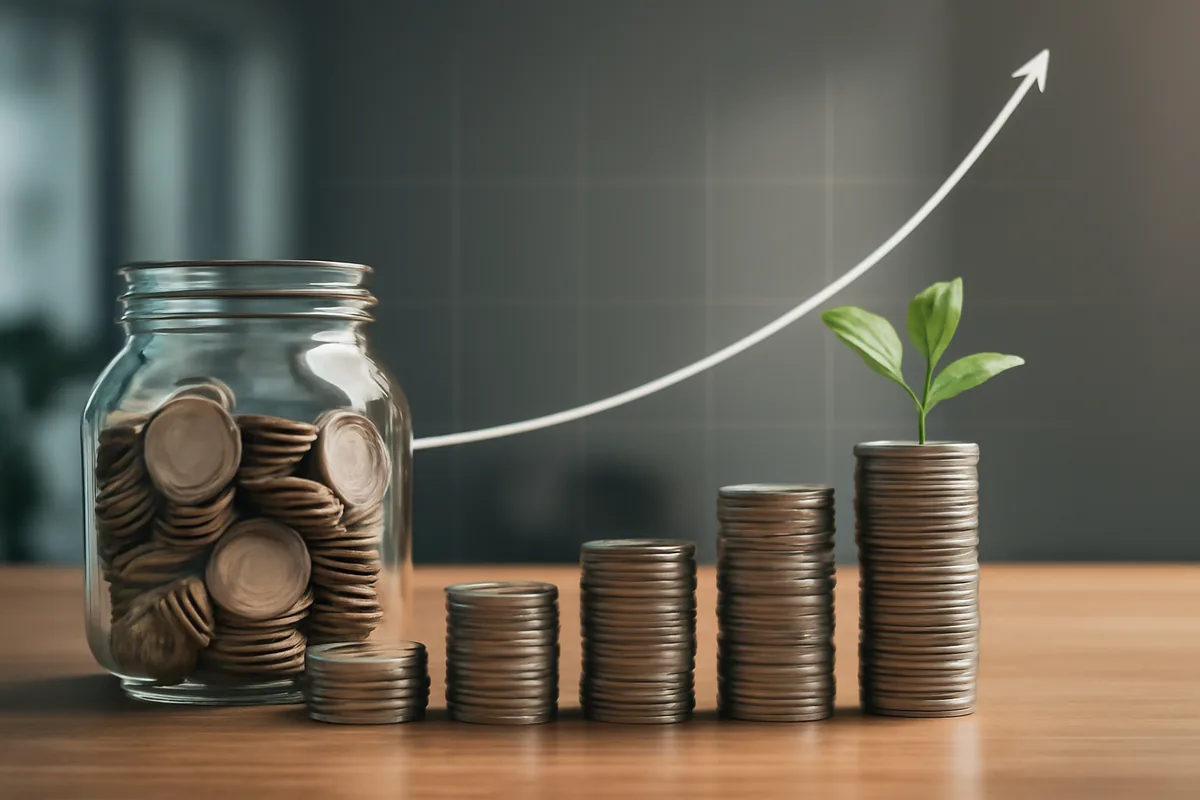
Why it matters: Somewhere in this decade the account crosses a psychological and mathematical threshold. Earlier, her savings carried the portfolio. Now the portfolio starts pulling its own weight, generating returns on prior returns. A 7% gain on a $200,000 balance is $14,000 in a single year — more than twice her $6,000 annual contribution. The engine is finally producing more than the fuel she feeds it, and the curve begins to bend upward rather than climb in a straight line.
Years 20–30: The crossover accelerates
At the 30-year mark, our investor has deposited $180,000 total. Her balance? Approximately $610,000. Growth alone now stands near $430,000 — more than double everything she has ever contributed. In this single decade, the account roughly doubled again, adding some $350,000, of which only $60,000 came from her paycheck.
Why it matters: This is where compounding stops being a savings strategy and starts behaving like a self-funding machine. The annual returns on a half-million-dollar balance — well over $35,000 in a good year — dwarf anything she could realistically add from income. Her contributions become a rounding error against the growth. For anyone who stuck it out through the flat early years, this decade delivers the emotional reward: the number finally moves in leaps that feel disconnected from personal sacrifice.
| Milestone | Total contributed | Approx. balance | Growth portion |
|---|---|---|---|
| Year 10 | $60,000 | $86,500 | ~$26,500 |
| Year 20 | $120,000 | $260,000 | ~$140,000 |
| Year 30 | $180,000 | $610,000 | ~$430,000 |
| Year 40 | $240,000 | $1,310,000 | ~$1,070,000 |
Years 30–40: The exponential payoff
In the final decade, our 55-year-old rides the steepest part of the curve. She contributes another $60,000, bringing her lifetime total to $240,000 — and her balance more than doubles from $610,000 to roughly $1.31 million. Of that final total, about $1.07 million is pure growth. Put plainly: for every dollar she ever deposited, the market handed her more than four in return.

Why it matters: The last ten years produce more absolute dollar growth — around $700,000 — than the previous thirty combined. This is the defining feature of exponential curves and the reason financial planners obsess over starting early. The wealth was not built by clever stock picking or a lucky windfall; it was manufactured by the same $500 monthly deposit, left undisturbed long enough for the math to compound on itself. A five-year delay at the start would have cost this investor several hundred thousand dollars at the finish, because the missing years are the most valuable ones — the final doublings that only mature after decades of patience. The lesson holds in any market: the reward is reserved for the investor who lets time finish the work.
Of course, the exact returns any saver earns depend on the market they are actually investing in — which brings the story from four thousand years of theory to where things stand right now.
The Compounding Landscape in 2026
As of mid-2026, the environment for investors harnessing compound interest is defined by stabilization after a turbulent few years. The Federal Reserve has held the federal funds rate in the 4.0% to 4.5% range for most of the year, signaling a pause on the aggressive hikes of 2023-2024. This has had a direct impact on savers. High-yield savings accounts (HYSAs) and Certificates of Deposit (CDs) continue to offer attractive yields, with many online banks providing APYs between 4.25% and 5.0%, a stark contrast to the near-zero rates of the early 2020s. According to Bureau of Labor Statistics (BLS) data released in Q2 2026, inflation has moderated to a more sustainable 2.8% annually, easing pressure on household budgets and preserving the real returns on investments.
For equity investors, the S&P 500 has seen steady, albeit not spectacular, growth through 2025 and into 2026. The focus has shifted from high-growth tech stocks to companies with strong fundamentals and consistent dividend payouts. This environment underscores the power of Dividend Reinvestment Plans (DRIPs), where dividends automatically purchase more shares, creating a powerful compounding effect. Contribution limits for tax-advantaged retirement accounts also saw another cost-of-living adjustment. For 2026, the 401(k) contribution limit is $24,000 for employees under 50, while the IRA limit is $7,000, providing more room for tax-deferred or tax-free compounding.
What’s Next: Projections for 2027 and Beyond
Informed projections from major financial institutions suggest a continued ‘soft landing’ for the U.S. economy. Vanguard’s 2026 Economic and Market Outlook forecasts modest GDP growth and expects the Federal Reserve to begin gradual rate cuts in early 2027, which could shift the investment landscape. A lower-interest-rate environment typically makes bonds with existing higher yields more valuable and can spur stock market growth as borrowing costs for companies decrease.
Key trends to watch include:
- Asset Allocation Shifts: As HYSA and CD rates potentially decline in 2027, analysts at firms like BlackRock anticipate a capital rotation back into equities and longer-duration bonds to lock in yields. This reinforces the importance of a diversified portfolio that can perform in various rate environments.
- The Role of Automation: The adoption of robo-advisors is projected to continue its upward trend. Features like automated rebalancing and tax-loss harvesting, once reserved for high-net-worth individuals, are now standard. These tools help maximize compounding by maintaining a target asset allocation and minimizing tax drag without manual intervention.
- Legislative Watch: Discussions in Congress around a potential “Secure Act 3.0” are ongoing. Proposed provisions include further expanding auto-enrollment in workplace retirement plans and increasing catch-up contribution limits, which would provide additional avenues for older workers to accelerate their compounding journey before retirement.
The core principle remains unchanged: consistent, disciplined investing is the most effective strategy. The coming period may favor those who stay invested and allow their assets to compound through evolving economic cycles.
Conclusion
The economic climate of 2026 has created new opportunities and reinforced timeless truths about building wealth. While interest rates and market conditions will always fluctuate, the fundamental engine of financial growth—compound interest—remains constant. By understanding the current landscape, staying informed about future trends, and consistently contributing to a diversified portfolio, anyone can leverage this powerful force to build a secure financial future. Your best move is always the next dollar you invest.